
Abstract
College counselors rely heavily on demographic, academic, and socioeconomic data to effectively recruit and counsel prospective students. We hypothesized that an interactive data visualization of related subset of education data will help the counselors in their day-today jobs. We created Tableau dashboards to visualize a subset of the High School Longitudinal Study of 2009 dataset from the National Center for Education Statistics. These dashboard focused on students’ future plans and preferences for their postsecondary education institutions. By visualizing this dataset, we could show the issues that are important to students from different demographics, such as income and ethnicity, which would help recruiters reach out to a diverse group of prospective students.
Design question
How can data help college admissions counselors more effectively recruit and counsel prospective students
Target users
College admissions officers recruiting domestically in the United States
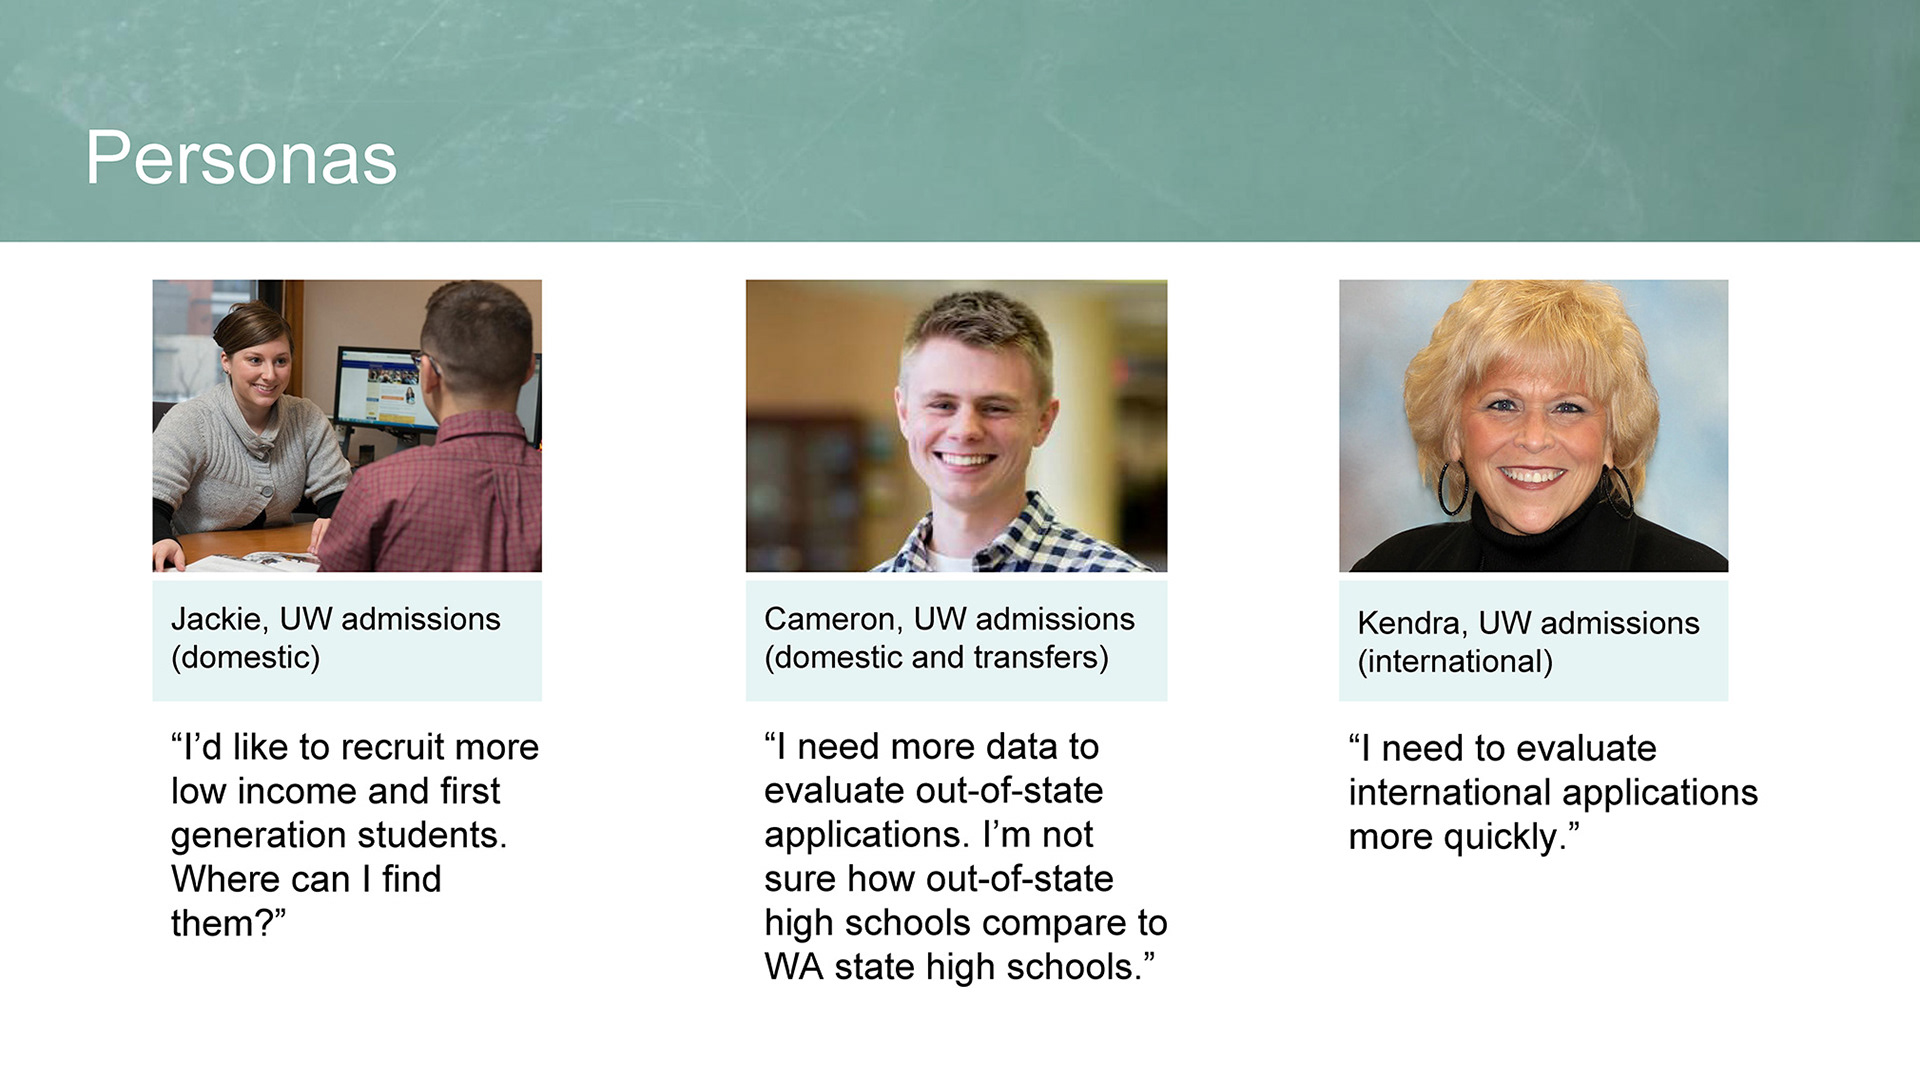
Interviews and personas
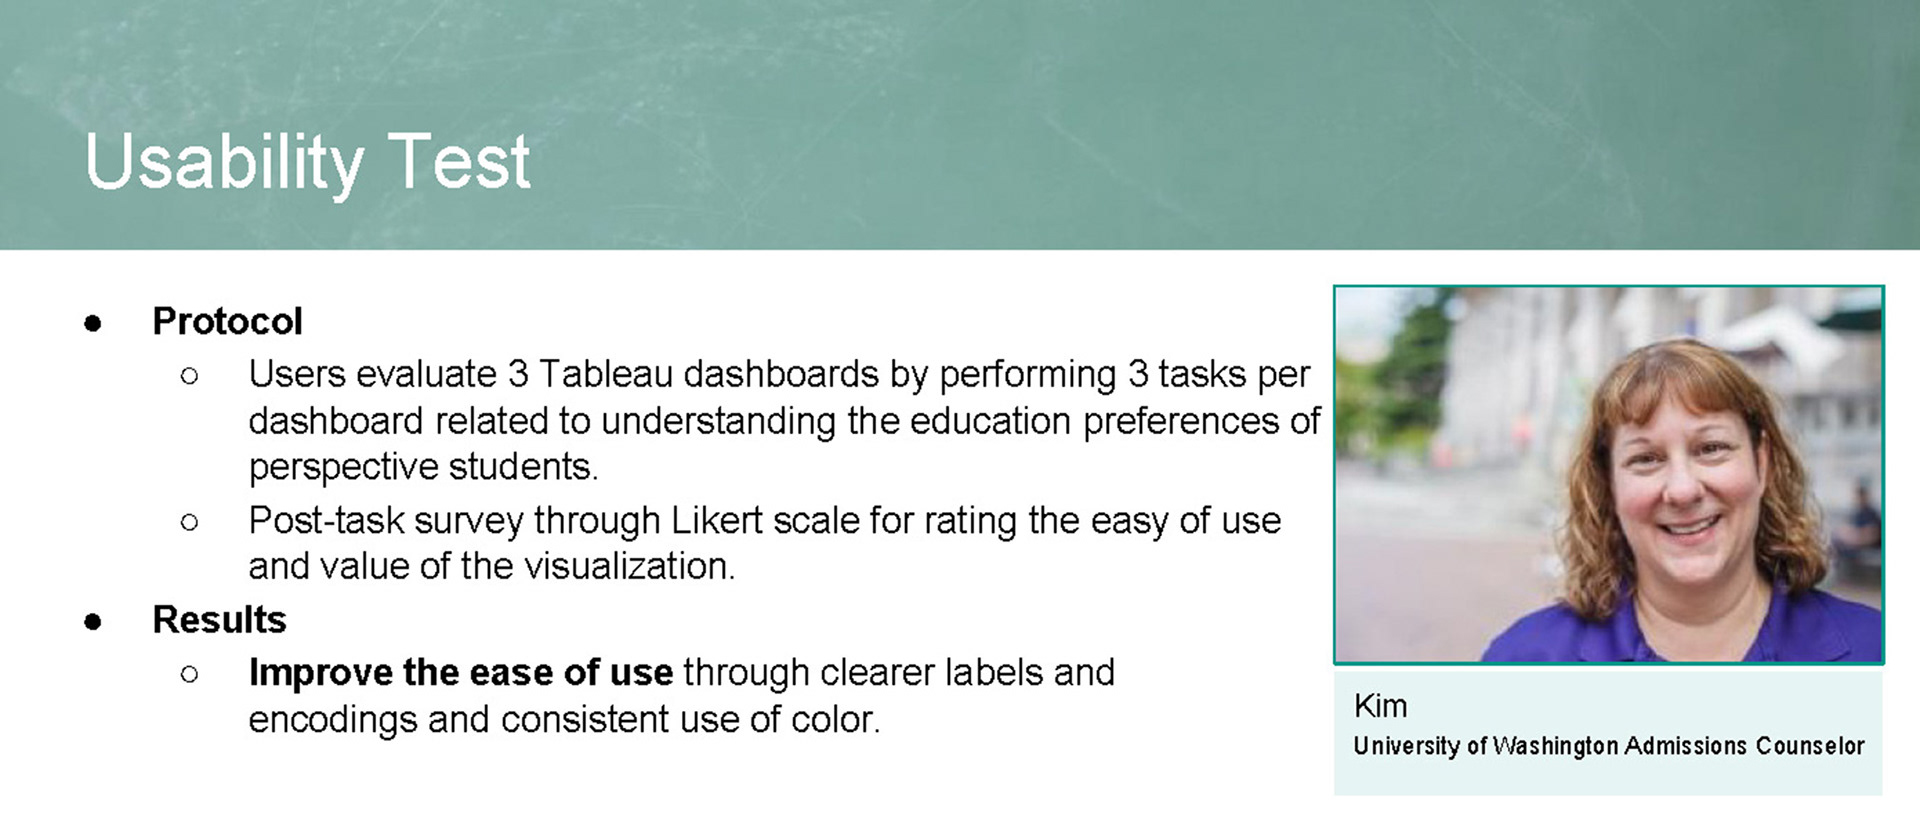
To understand how college admissions counselors use data in their work, we interviewed four counselors at the University of Washington. Interviews took place in person at UW and on the phone, with each lasting about an hour. Interviews were based on a set of questions. We used these interviews to create three new personas, Cameron, Jackie, and Kendra. While Cameron is primarily responsible for evaluating applications, Jackie andKendra focus on recruiting. We learned that college admissions counselors use academic and socioeconomic data to recruit students.
Data
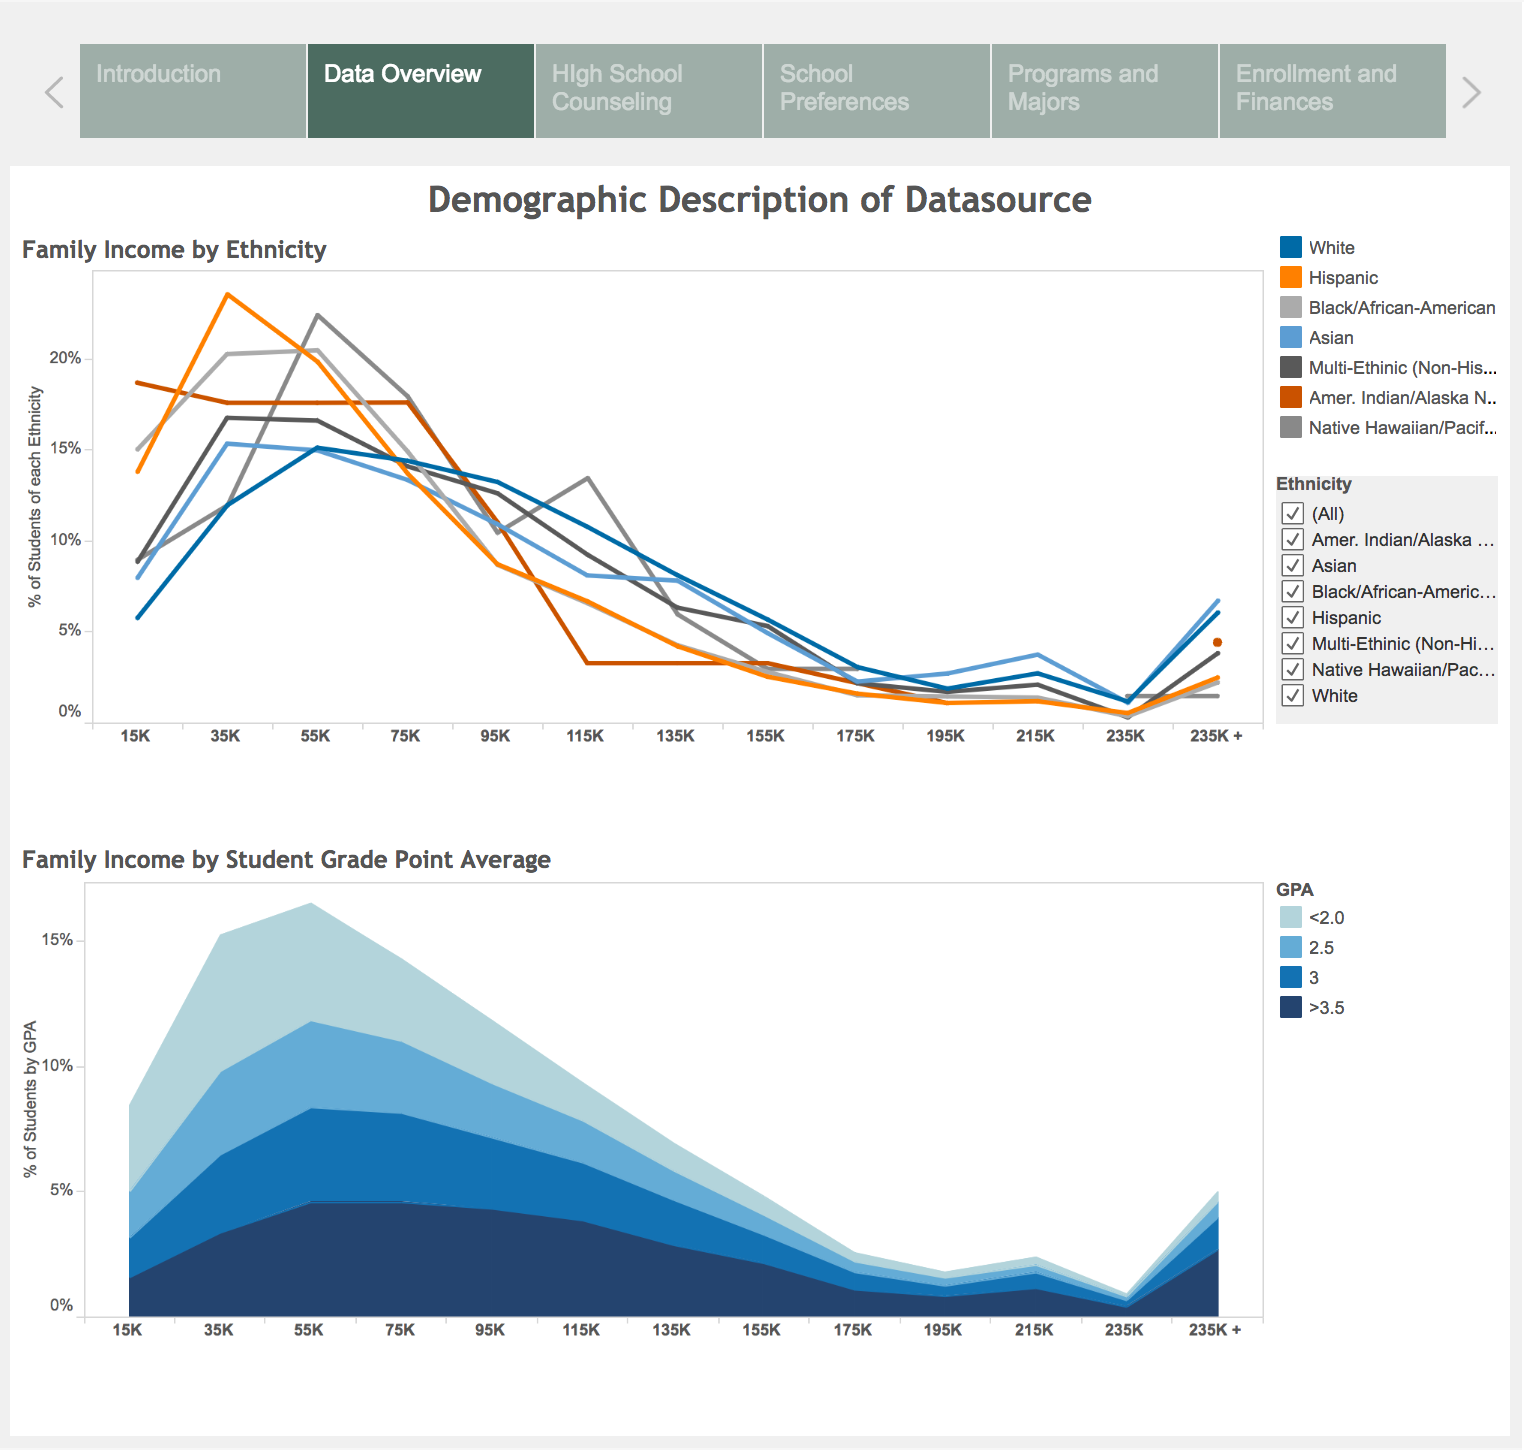
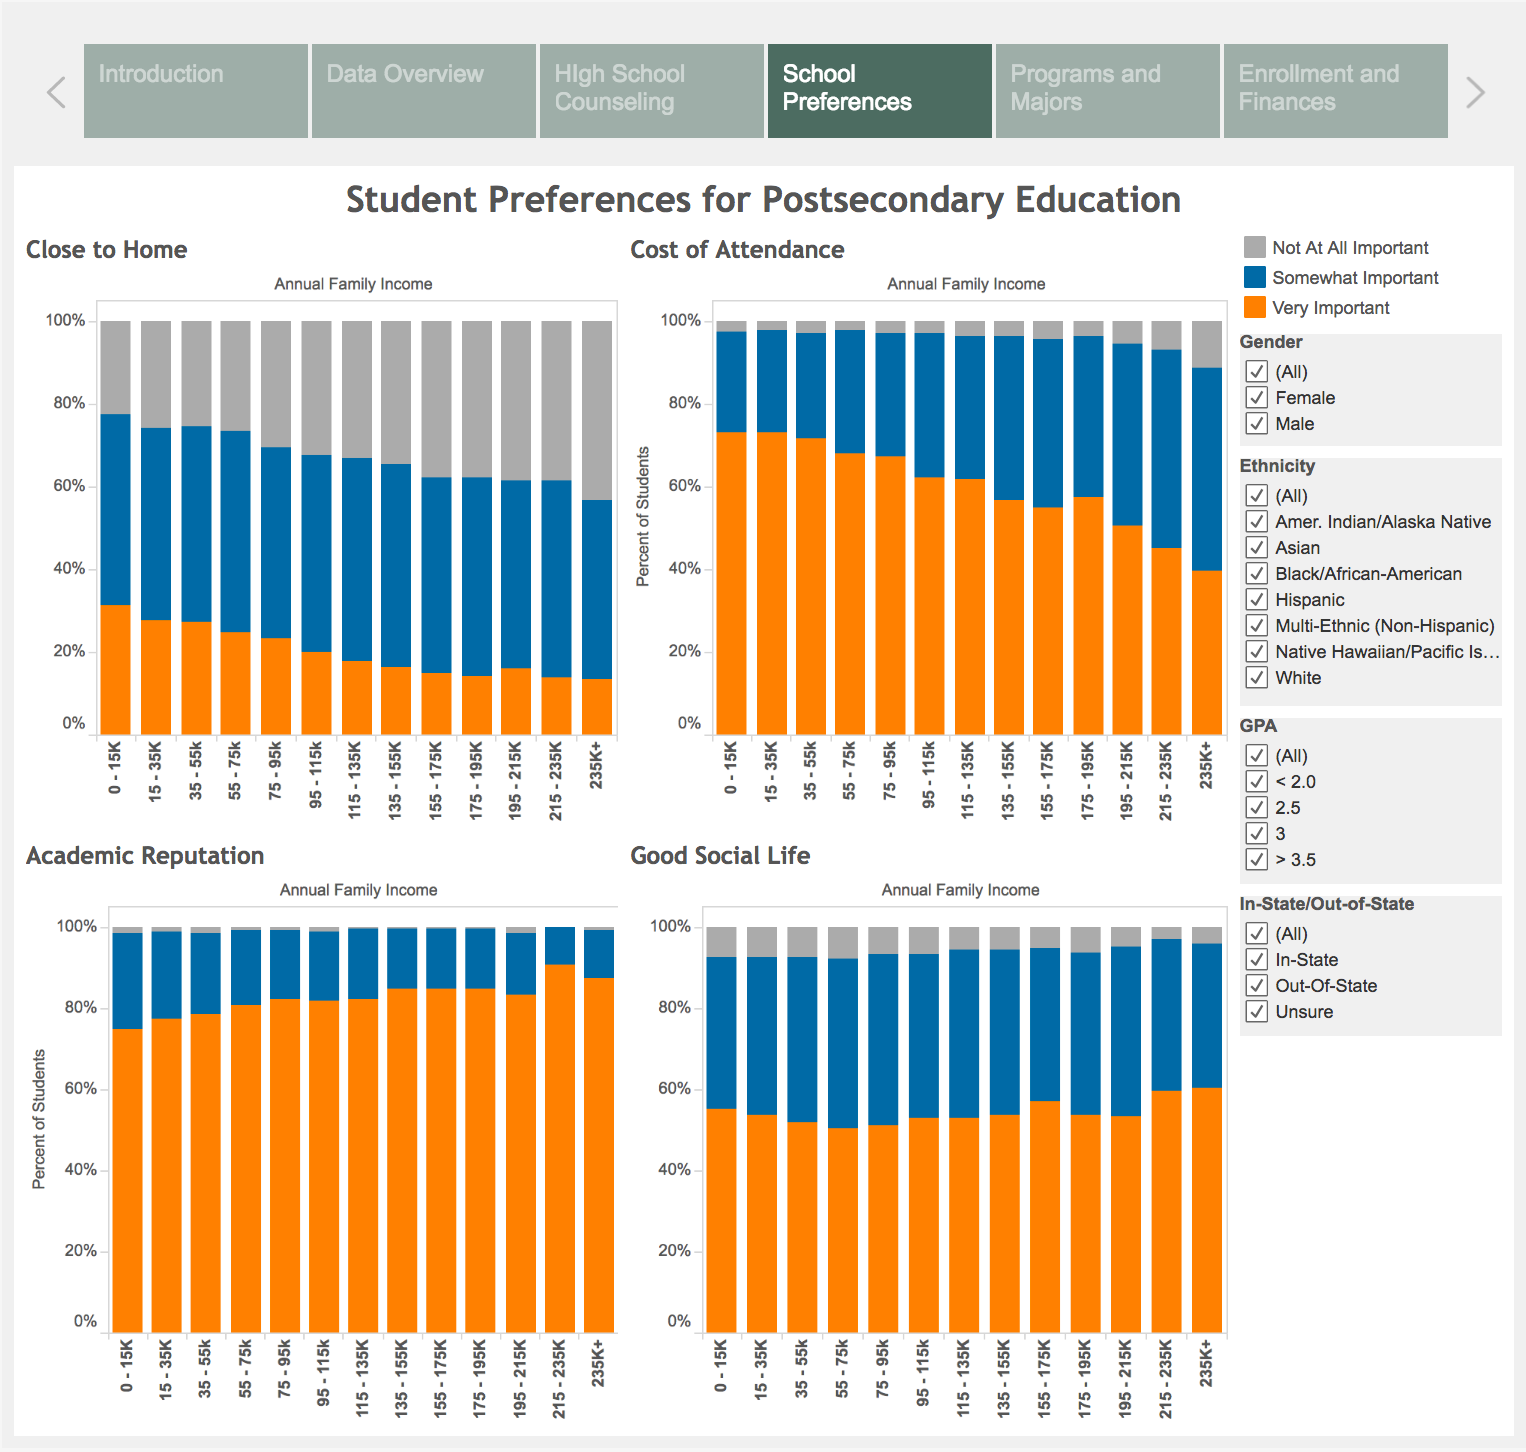
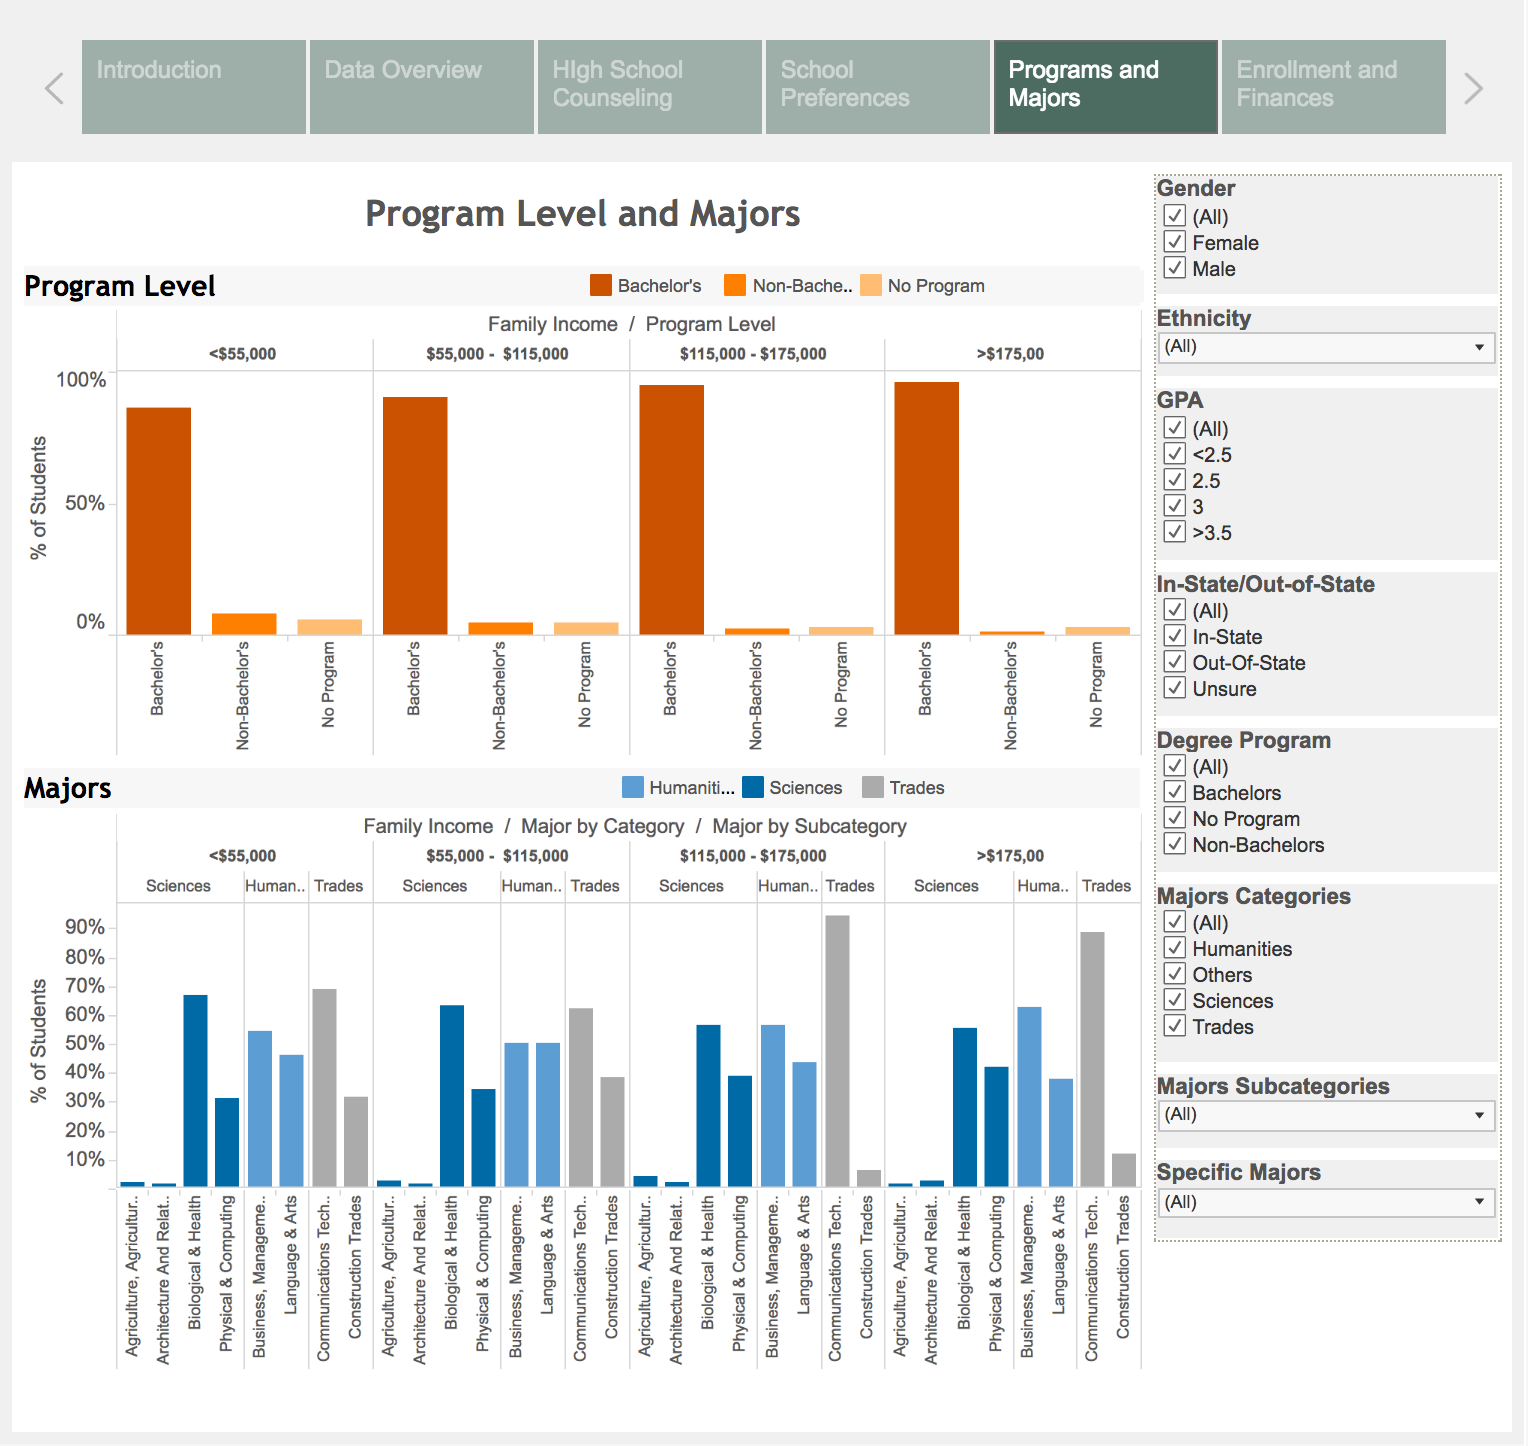
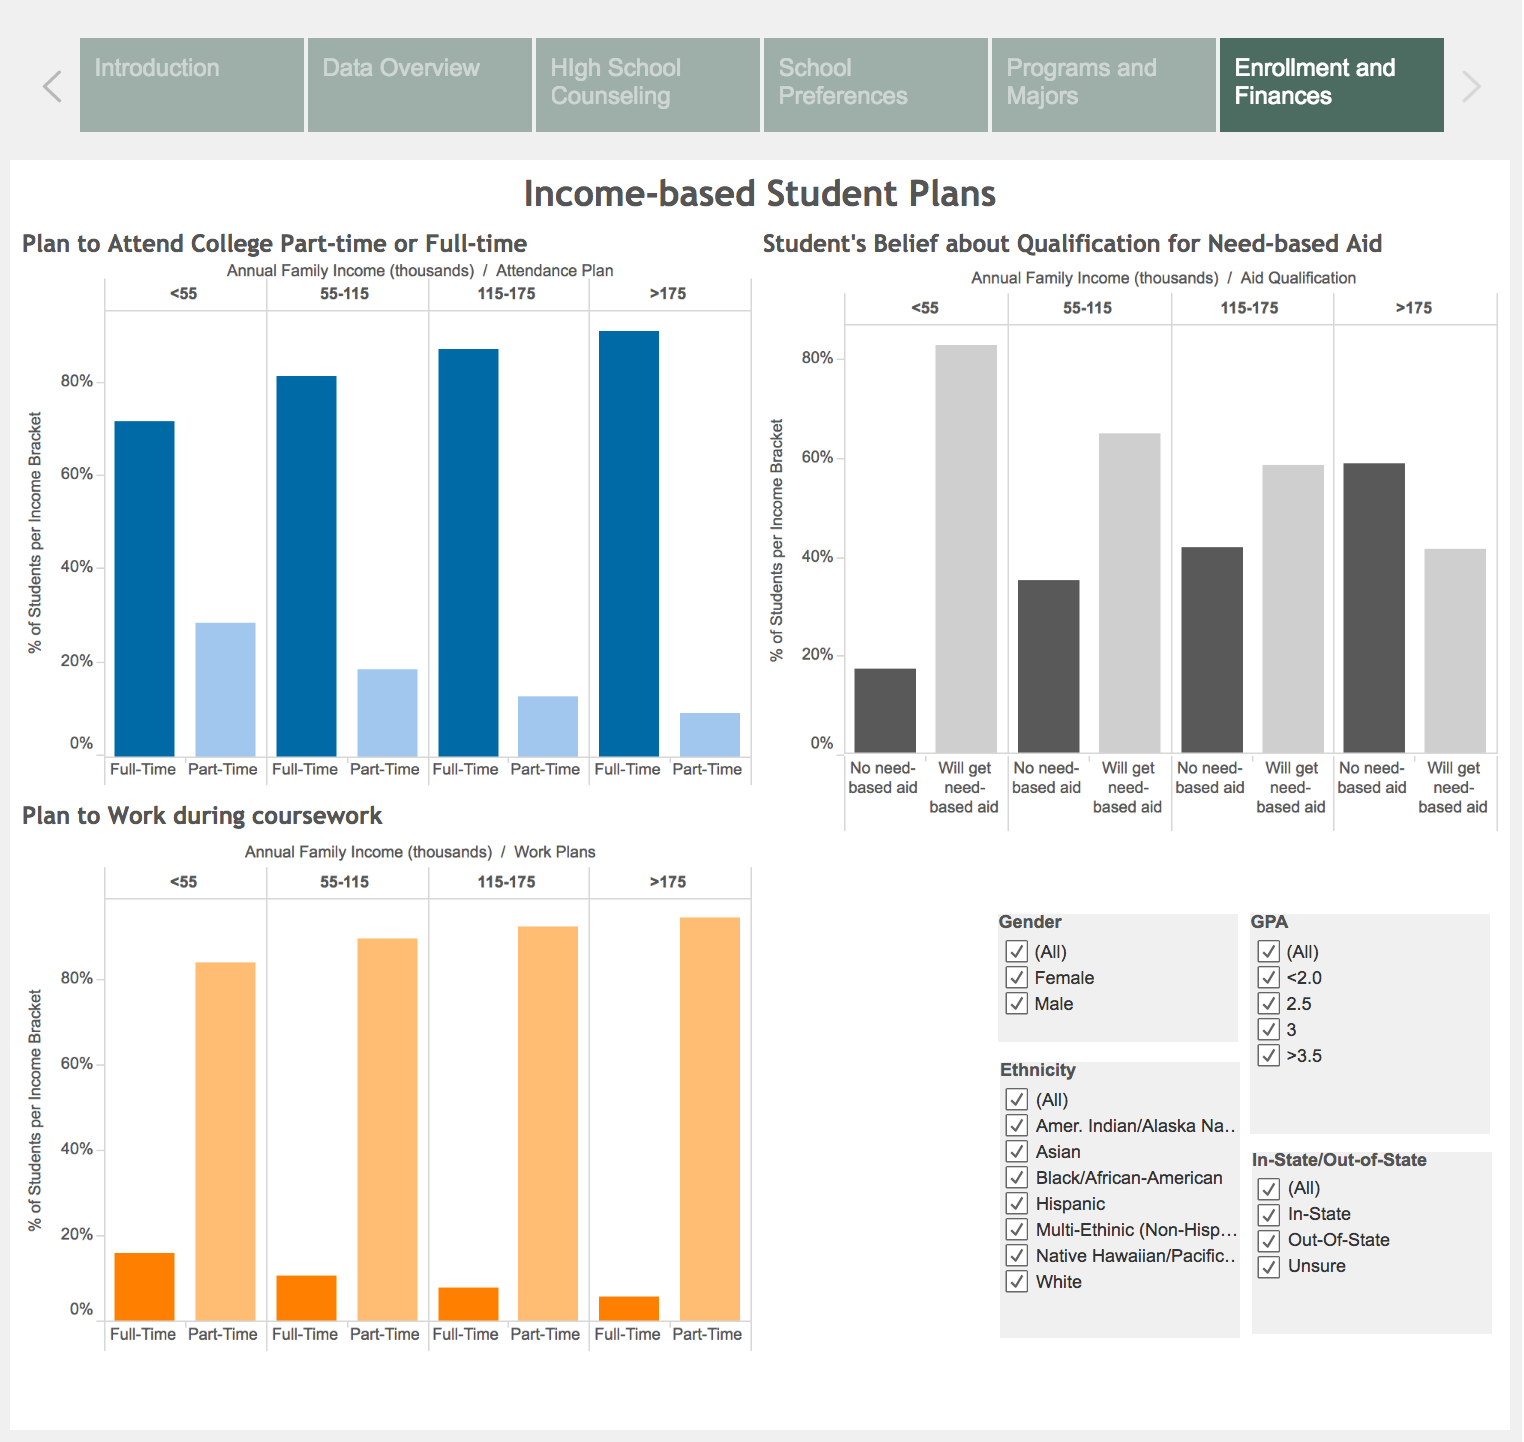
The data set contained categorical data (demographic, socioeconomic, academic) about 23,000 ninth graders from 944 schools starting from 2009. We extracted 30 variables from the study for our graphs.
The datasource website allows users to search for variables using keywords that describes the survey questions. We used this tool to learn about the dataset, and isolate the subset of relevant variables. Then we wrote a Python script using the Pandas library (used for data manipulation and analysis). Next, we explored the dataset using Trifacta (Appendix IV) to find frequency of missing data.
We chose variables related to the categories: family income, parents’ education, GPA, characteristics of the schools, type of programs offered, including opportunities for part-time and work-study programs. Since our dataset did not include geographic variables, we were unable to compare data across the country.
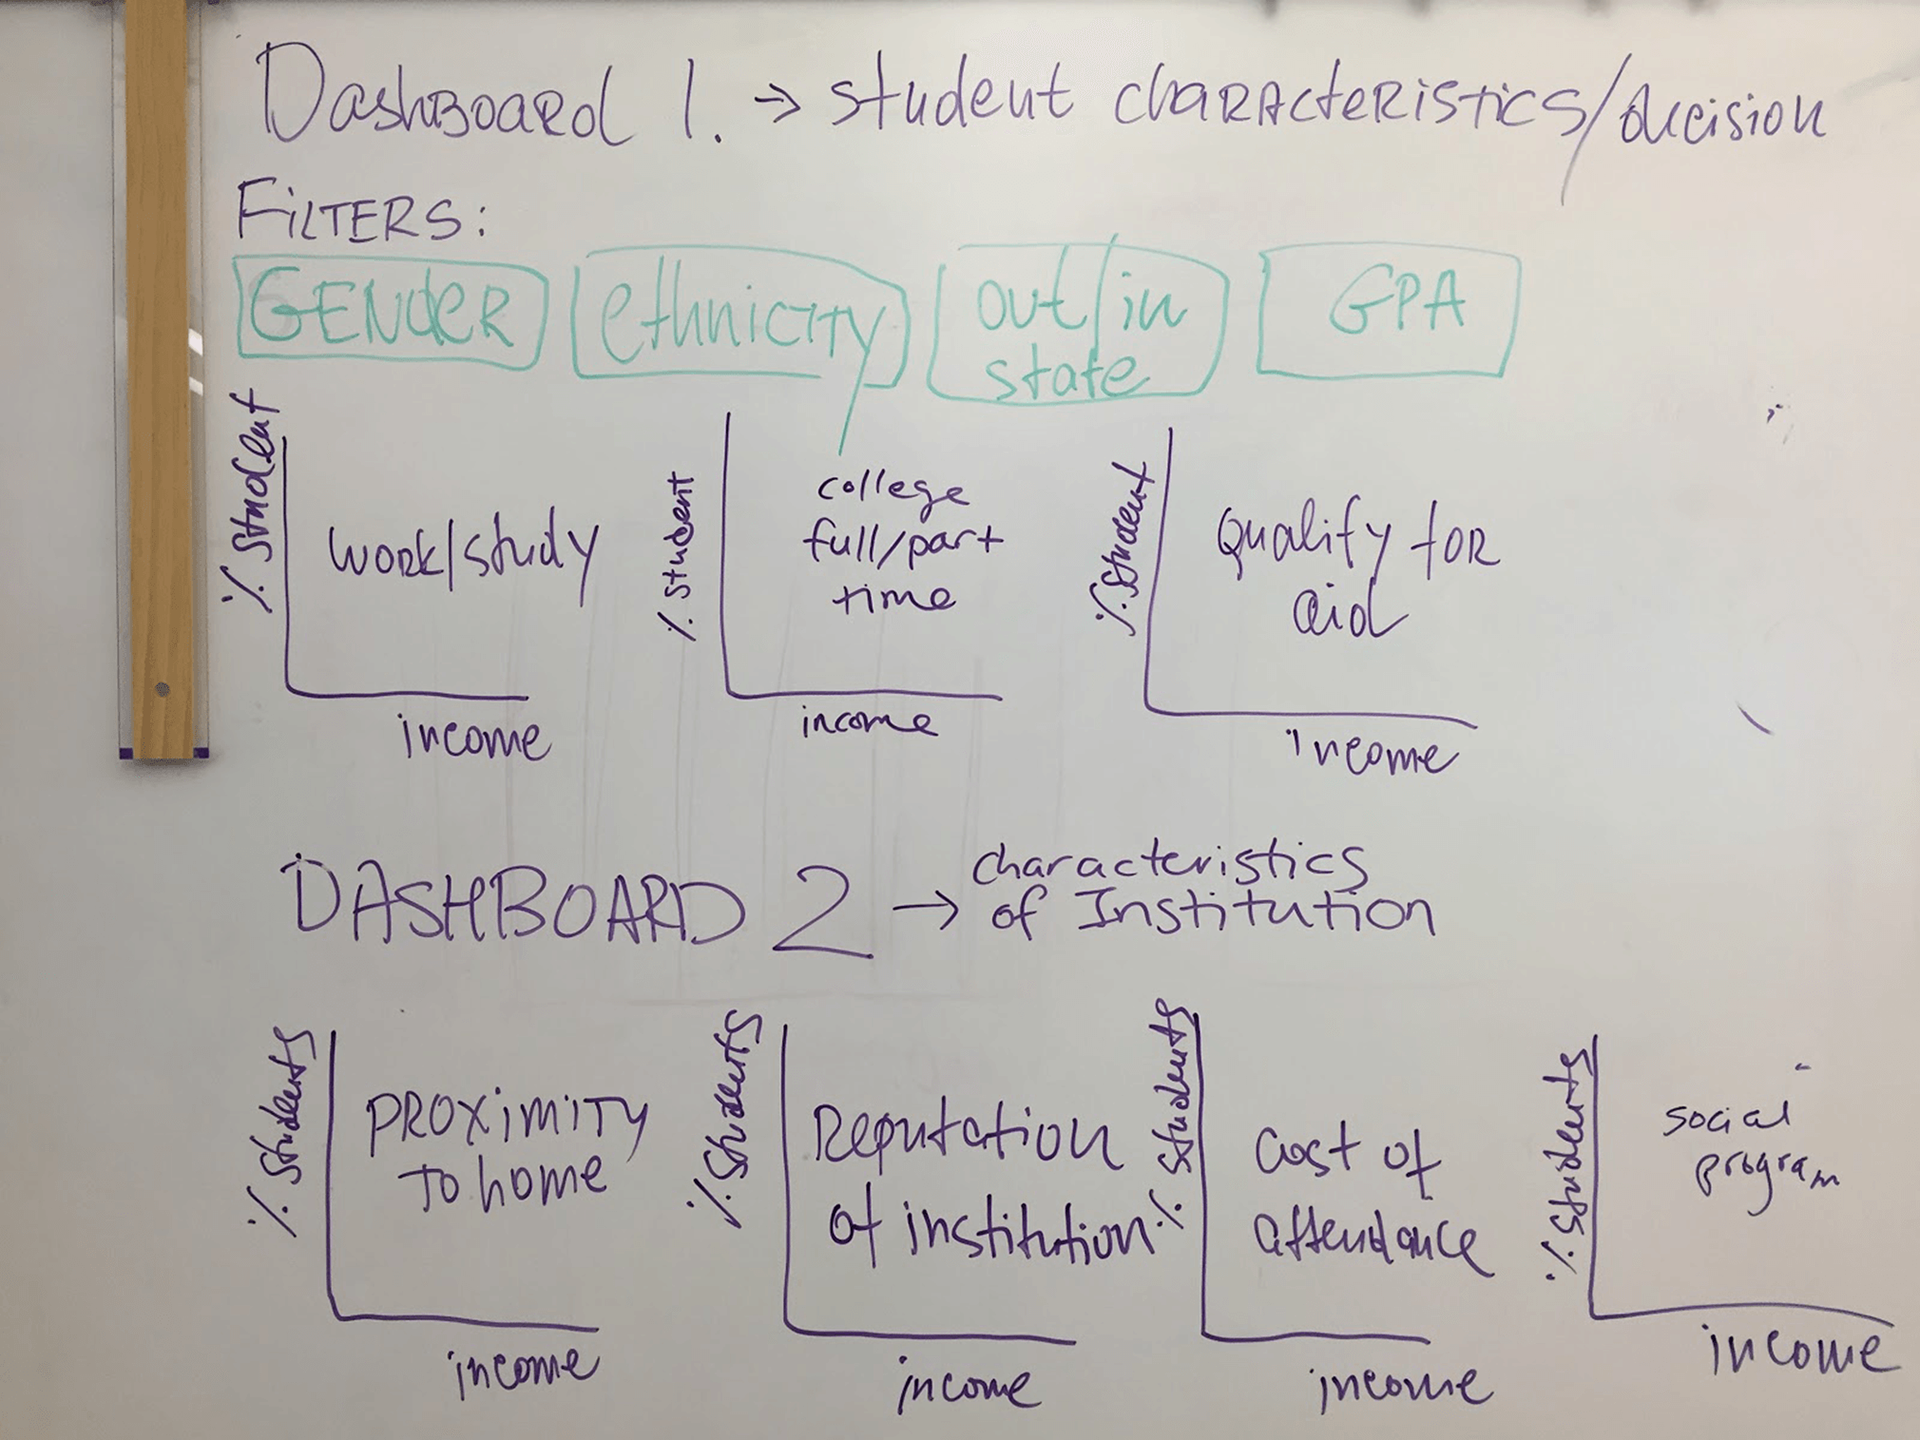
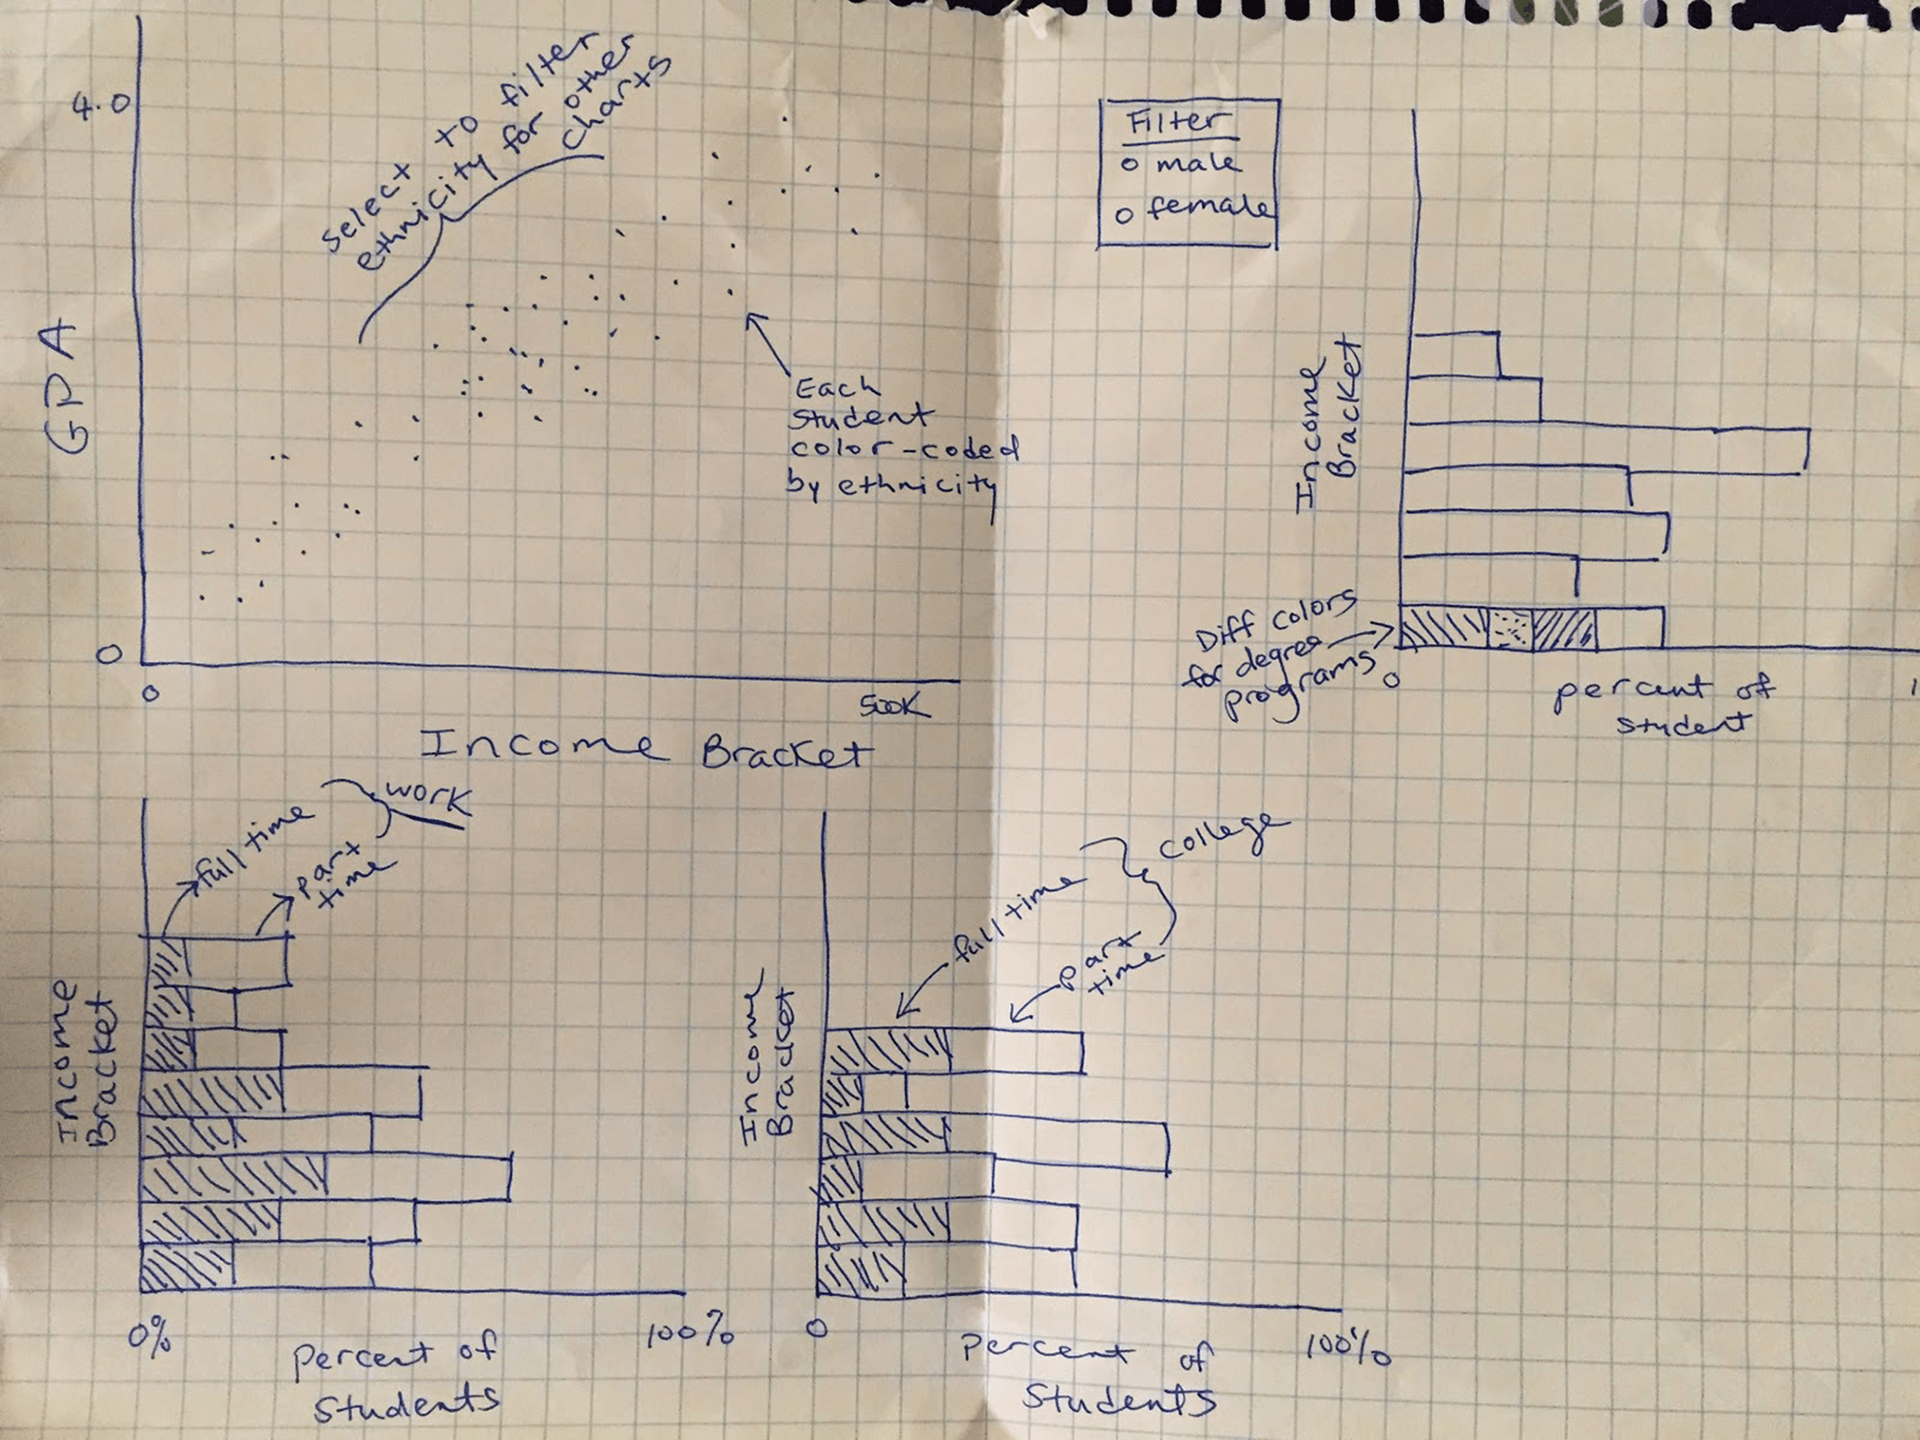
Ideation (Sketches)
To create our prototype we used data about
1. Student profiles:
- Demographics (gender, ethnicity, income)
2. Student needs:
- Distance from home
- Extracurriculars
- Finances (employment, financial aid)
- Academics (program, status, major, reputation)
- High school guidance counseling
Sketches: exploration of data about income, educational institution offerings, GPA and gender